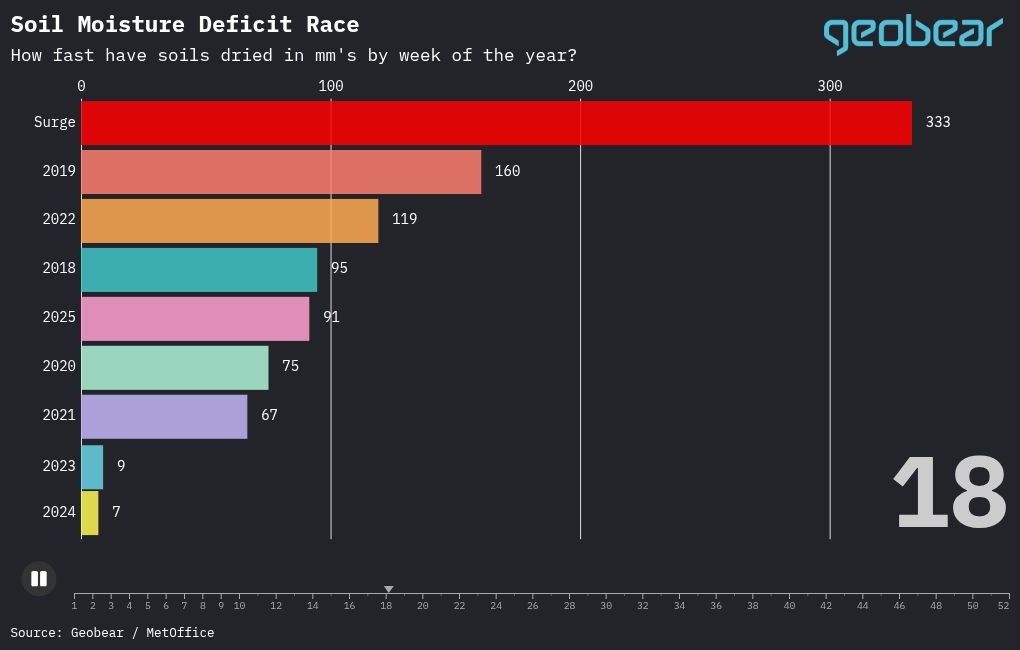
*Updated November 2025. This animated chart visualises the rate of soil moisture deficit (SMD) across recent years, from 2018 to 2025 by week. Soil moisture deficit refers to how much water is needed to return the soil to full capacity, and as it increases, the risk of ground movement and subsidence grows, especially in shrinkable clay soils. Learn more about what subsidence is.
A key threshold is marked at 333mm of deficit. When this level is exceeded and sustained for multiple weeks, it often signals the conditions for a subsidence surge — a seasonal spike in subsidence-related property damage and insurance claims.
By comparing year-on-year trends, this animation highlights how drier summers and prolonged deficits are becoming more common, offering early warning indicators for both homeowners and insurers. 2025 has now peaked, and the subsidence surge has now receded; the rainfall is increasing moisture in the soils.
Note – 2025 drops off after week 37, due to not having future data at the time of publication.
Geobear is pleased to offer first-class subsidence solutions. Get in touch with us today to find out how we can help you.